
Path Dependencies Between the Atmosphere and the Economy
Seasonal to Subseasonal Signals for Global Food Security


If agriculture fails, everything else will fail.
This statement is attributed to the late Dr. M.S. Swaminathan, one of the world’s leaders in the green revolution and colleague of the late Dr. Norman Borlaug. I would add a slight modification to the statement by adding ‘energy and water’, but this can not be underestimated as a fundamental pillar of a stable society. We might think that the winners of the ‘AI wars’ will be those countries that possess technical superiority with respect to computational and data sciences and capabilities. But without access to a stable and cost effective agriculture and energy production and distribution system, technological wins will only be temporary .
Natural resources are and will remain the cornerstone of the global economic, socioeconomic and geopolitical engine. Here, the emphasis is on food.
While artificial intelligence and large language models continue to dominate short term market behavior, capturing the aspirations and imagination of investors, entrepreneurs and policy makers alike, there are a series of more fundamental risks and opportunities that do not command the same degree of attention, but are far more important as viewed through the lens of economic and geopolitical security. As the threats and opportunities that drive the global agricultural system have become more obvious in recent years, the recognition that preparing for new and emerging supply-side threats can be a source of competitive advantage to those who prepare for pending volatility. Within the last month, there have been disruptions to food supply and or price in dairy, poultry, grains, sweeteners, and energy, whose ripple effects are not contained to the country of origin.
In recent years, risks have emerged which have been shown to stress both production and trans/intercontinental distribution of food, fiber and material commodity derivatives. Supply side risks are triggered by any number of catalysts; among them, weather/climate disruption, geopolitical activity, and natural/manmade disasters. Predicting these disruptions is a fool's errand. However, preparing for them can be immensely valuable.
The issue with respect to risk identification used to be a dearth of data. Fast forward a couple of decades, and the risk is now one of abundance. There is so much real time information that is now available to decision makers, it can serve to obfuscate rather than enlighten. False positives and overfit models are ubiquitous, so for the individuals and organizations who are responsible for identifying and managing physical and financial agriculture risk, traditional tools and techniques are no longer sufficient. Understanding the increasingly complex global supply chains now requires a new ontology, allowing for the separation of signal from noise.
Research into the risks and opportunities associated with the global agricultural value chain shows that today’s physical commodity analysis is increasingly making use of alternative data and techniques to aid in decision making. However, many of these tools are not in the purview of those responsible for risk management. It is time to leverage a new framework to understand and manage agriculture risk using a process that has evolved to make use of discretionary, scientific and quantitative elements, resulting in a distinctive view on the ‘where, when and why’ questions that impact global commodities. As food and natural resource security become more integral issues of importance to countries and corporations, such an evolving framework should be expanded and adopted across commercial and geographical sectors. While the risk applications are the focus of this article, the same methodology can be applied to identify regions where impacts to agricultural productivity and yield crops can trigger situations leading to food insecurity for vulnerable populations.
First Principles Data
One way to look at agricultural commodity production potential is to take a mass balance approach through the use of physical climatological teleconnections. Energy transfer in one region, manifests itself in another, at all scales of lead and lag time between cause and effect. We need to break these relationships down to first principles in order to better understand them. The climate energy system is among the most complex of puzzles.
Analysts already deploy this type of analysis at a high level, but there is much more to add with the right blend of data, science and analysis, particularly when blending physical, biophysical and economic data. For example, whenever agriculture traders hear that one of the several global meteorological agencies is calling for an El Nino event, many immediately start to position trades for a drier than normal Southeast Asia, a warmer pattern building for much of North America, and subsequent positive and negative impacts on crop development and yield. As the climate system is one predicated upon chaos, this rule of thumb does not always materialize, but in general, there are patterns that typically follow a phase change which provide enough information for some to take early anticipatory action. If we extend this logic a bit deeper, we can use physical time series data, coming from both empirical and reanalysis sources, and blend with pattern recognition models to construct potential forward scenarios on supply, distribution and price. We can do so with a more thorough understanding of some of the physical and operational mechanisms that serve to guide agricultural productivity and yield, by commodity and variety, instead of relying solely on all-too fallible econometric models.
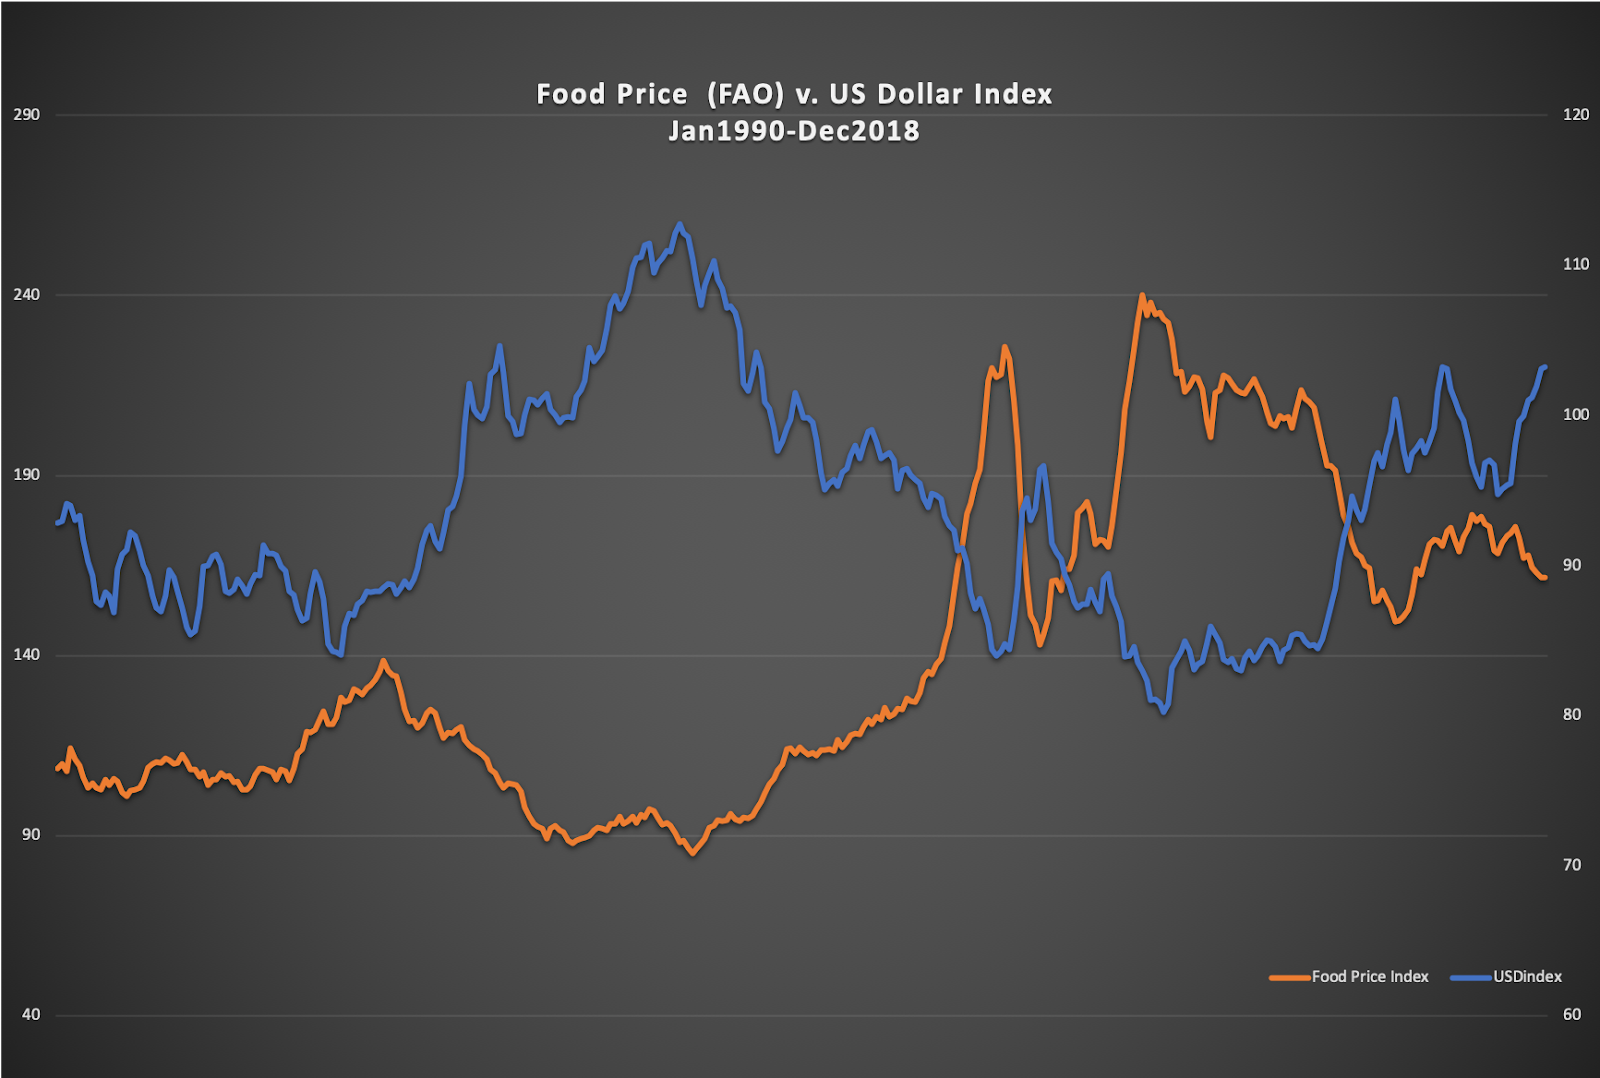
There are well-established relationships between macroeconomic variables and global commodity prices, which generally hold up over time. USD strength and global commodity prices tend to display an inverse relationship, (the USD index v. the global food price index from 1990 through 2018 is shown below). Any price analysis which disregards some of the more robust macro relationships would be incomplete. However, these relationships do not tell the complete story when assessing performance and sector risk, as most analyses already have many of these factors priced into their estimates. In this case, the market serves as the official scoreboard.
After using this generalization as a starting point, we can extrapolate these types of rules to construct a framework that incorporates specific geospatially referenced physical and biophysical variables, many of which are not necessarily within the purview of most market participants. In order to gain an edge in identifying potential gaps in physical and biophysical expectations, we turn to non-traditional data sources, which by and large are not exploited via both traditional discretionary and quantitative techniques. In this case, we suggest a move to incorporate global climate indices. Additional publications will go into greater detail emphasizing (a) the incorporation of additional physical and satellite derived time series data as well as macroeconomic data, and (b) more granular relationships per commodity category.
Primary Climate Indices - Steering Currents
Prudent strategies that target supply chain risk should be predicated upon identifying climate variables that serve as enablers or limiting factors, with respect to agricultural productivity (total mass) and yield (extractable quantity per area unit). One approach that is part of this framework attempts to utilize non-standard climate index data, typically collected and maintained by one of several global governmental meteorological agencies. As we focus our approach on time series global climate indices, we attempt to identify precursors that serve as catalysts to forward price behavior, providing an advantage over conventional analytical methods.
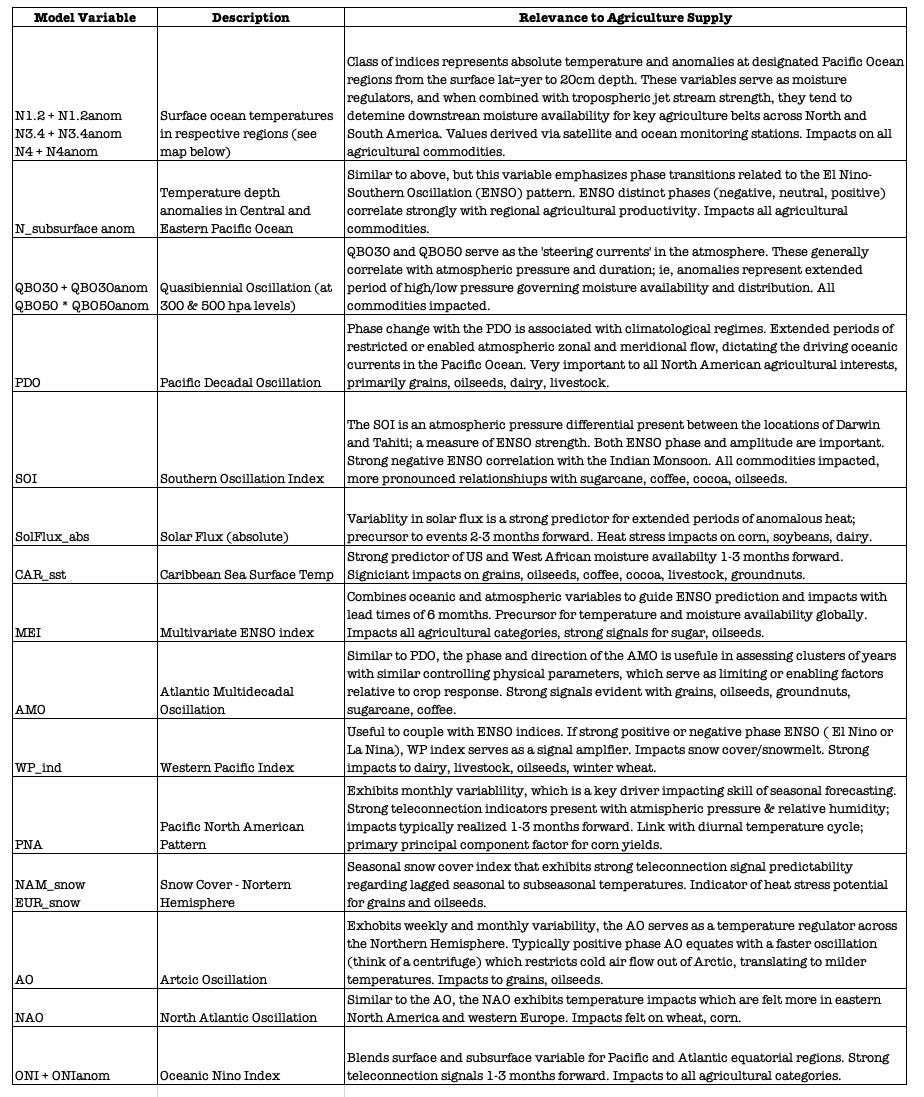
Proprietary research has uncovered strong relationships which connect the physical variables that are most closely correlated to global agricultural productivity across all commodity asset classes. These relationships also obey the laws of physics, so they are scientifically defensible. This is not always the case with quantitative models. The remainder of this discussion below summarizes the climate variables which have been selected, and their relationship to crop growth; a summary table for quick reference is included. We then describe in more detail two oscillations that are key drivers for agricultural productivity and food security: the El Nino-Southern Oscillation, and the Quasi-biennial Oscillation. Future research will be expanded to include additional physical climate indices, and also other forms of data such as satellite imagery, field trial data, and sensor data, in support of the construction of a more granular global database of causal mechanisms and their descriptions. These relationships will serve as the ‘rules’ for machine learning implementation and scenario planning.
El Nino-Southern Oscillation (ENSO) and the Quasi-biennial Oscillation (QBO)
In addition to macro variables which are partial price determinants, the time series index data in the table below was selected via discretionary research supported with peer review literature, to have the most significant impact on agricultural yields, supply, and price.
ENSO variables are the primary ’selective pressures’ which exert an influence on controlling the variation and distribution of temperature, moisture, relative and specific humidity, to the world’s primary agricultural origins. When examining ENSO phase, we look at the equatorial Pacific Ocean first to assess ENSO phase and transition. When we refer to an El Nino pattern, we are typically referring to a warm-Pacific Ocean sea surface temperature (SST) phase; the opposite La Nina pattern is associated with cooler Pacific SSTs, and a warmer Atlantic Basin. Both phases have specific influence on the behavior of the jet stream, which governs moisture availability across much of North and South America. Temporal variations associated with El Nino patterns varies, and often is a function of surface and subsurface Pacific SSTs, and an atmospheric teleconnection pressure differential between geographic locations in Darwin and Tahiti.
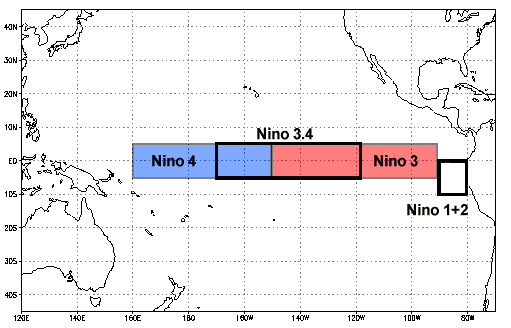
When a positive phase ENSO develops, SSTs in the Nino4 (N4) box (see map below) begin to exhibit elevated temperatures when referenced to normal. This is also accompanied by a shift in the equatorial tradewinds across the Pacific Ocean. Typical tradewinds in this region are ’easterly’, originating from the east and steering moisture and currents westward across the Pacific Ocean. When a positive phase El Nino develops, the winds shift to a westerly pattern, originating in Southeast Asia and moving currents and associated convection eastward across the Pacific Ocean towards the Americas. As a result, moisture that is normally available to agricultural origins across the Asia Pacific region at large, migrates away from the region and the result is often moisture deficiencies which impact several agricultural interests, leading to a potential trigger of food shortages.
As stronger El Nino patterns develop, the warm surface and sub-surface masses influence the amount and distribution of rainfall that is captured by the jet stream and delivered to agricultural belts in North and South America. The volume of warm water which makes its way to the surface increases, and excess evaporative moisture is then captured through convection; the beneficiaries of this additional precipitation (typically Brazil, Argentina, portions of the US and Mexico) receive more rainfall than climatological normal. It follows that when the opposite La Nina pattern is dominant, these regions experience moisture deficiencies. El Nino phases tend to operate on cycles anywhere between 8 and 24 months; in extended El Nino events, we often see two positive phases within the cycle.
The phase of QBO is also important to global agriculture interests, as this serves to dictate where extended regions of high and low pressure will situate. High pressure regions serve to block moisture from entering an area; conversely low pressure anomalies are oftentimes associated with enhanced storm tracks and above normal moisture. Transitions between west and east phase QBO generally occur of a frequency of 7-12 months. Periodicity has been observed to become more active both in terms of phase and amplitude. As with ENSO, there are specific QBO signatures associated with moisture delivery to agricultural origins and a better understanding of the loading patterns behind these transitions will allow for early identification of target precursors, which impact global agricultural yields.
Summary
Managing risk around global agricultural productivity can be problematic for decision makers in commercial and food security circles. Weather and climate disruption across the agricultural supply chain makes supply-side planning difficult for physical and financial forecasting. As discussed, there are even more important socioeconomic implications to consider when climate phase changes materialize.
Coupling physical, biophysical and economic data with pattern recognition techniques is a way to anticipate and manage risk in today’s increasingly complex world. Through the incorporation of differentiated Earth observation data and processes, learnings can be mapped to a variety of global agricultural commodity exposures. As a result, the astute analyst can identify the most relevant combination of macro/climate variables with sufficient lead time, in order to prepare for and proactively react to emerging threats. The identification of climate precursors to global agricultural productivity is important for developing an early read on supply and demand drivers, and also for anticipating inflection points in supply, leading to price reactions ahead of the market. Numerous physical variables have been identified as key pieces to the puzzle with respect to signal identification and optimization, and continued work in this area will provide risk managers with a suite of favorable and geographically specific mitigation strategies. This approach also minimizes risk and protects against knowledge decay, as each day, week and month that new data becomes available, new relationships can be elucidated and verified. Future articles will examine many of these topics in greater detail, and this will generate ideas for new strategies to manage risk.
As always, preparation trumps prediction.
—-----------------------------------------------------------------------------------------
This paper will be published as part of the Path Dependencies Between the Atmosphere and the Economy series.
Dr. Michael Ferrari is the Chief Scientific and Chief Investment Officer at AlphaGeo, founder and Managing Partner at Atlas Research Innovations, and advisor and partner at Weather Trends International.